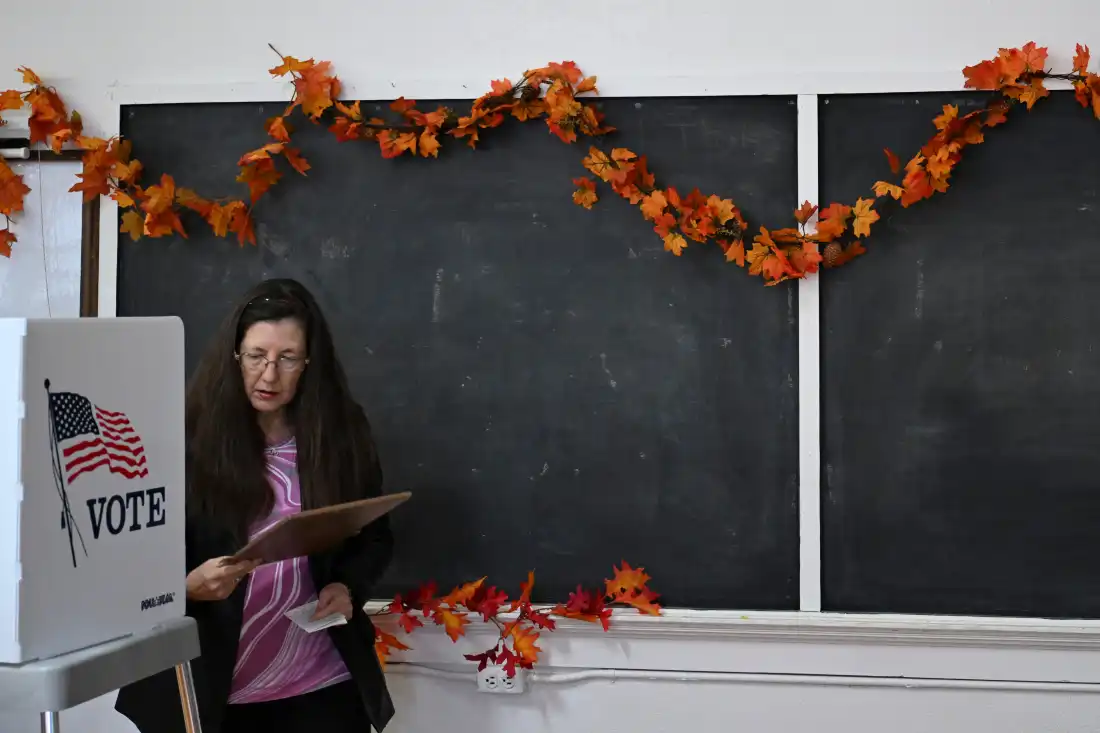
The midterm elections brought insights into how diverse demographic groups cast their votes. Bonnie Ford was among many voters participating at the De Borgia School in De Borgia, Mont., on Tuesday.
The data presented below showcases voting preferences among different groups. These figures represent the percentage of voters supporting a House candidate from each political party.
The information is derived from a comprehensive poll conducted by SSRS for various news media, including the Associated Press. Tens of thousands of voters contributed to this dataset, ensuring a broad representation. The total sample’s margin of error is approximately ±0.6 percentage points.
The analysis is ongoing and more information is expected to be available soon.
Leave a Reply